
How large are the arbitrage opportunities in Eve Online?
2023-09-23
I just noticed that we're now past the 10th anniversary of my first blog post, which I made on 2013-08-11! Maybe I'll write a retrospective. Moving on.
Recently, a friend suggested I'd be interested in EVE Online. For those not familiar, it's an MMO with lots of stuff but in particular, it has a player driven market economy. Prices are driven by market forces. Players place buy and sell orders for various items, other players fill those orders, market prices move over time.
It's exciting! CCP (the developers of EVE) even employ economists to help manage the in game money supply and inflation. Very exciting!
With any market the question is: how can I make the most money as quickly as possible for the least effort?
In real life, the answer may be to get a job. In EVE, I thought the answer might be to find and exploit arbitrages: market mispricings where someone is selling for a low price and someone else is buying for a high price.
Websites like eve-trading.net exist but don't let us answer the following questions:
Given an initial investment and fixed cargo space, which opportunity has the highest return (%) per jump? How does that vary with available capital? Warren Buffett famously said that having a small amount of money to invest is the trick to making good returns. Having $100B in cash is a curse - most "good" opportunities are simply too small.
Has the size of arbitrage opportunities changed over time?
Historically, where (in which systems) are the best opportunities?
These questions can be answered by downloading these datasets:
Market data from https://data.everef.net/market-orders/
Static data (e.g. about jump routes and how much cargo space items take up) from https://wiki.eveuniversity.org/Static_Data_Export
And doing some analysis. That's what I do in this post.
Getting the datasets
The market data from https://data.everef.net/market-orders/ is easily available, just download the files you want from your browser. For bulk downloads, follow the instructions here to use wget to download everything you want.
The static datasets don't require bulk download, just download them from your browser, you'll only need one file per dataset.
Setting up our analysis
I just used a Jupyter notebook and pandas to go through this dataset. The 2023 dataset up to the day of posting this is under 200 GiB, so it's not huge and can easily be analyzed on a laptop.
I also used the networkx package to create the EVE universe graph and calculate shortest paths.
The Jupyter notebook I'll be screenshotting graphs from is available in full from https://github.com/kaashif/eve-arbitrage-finder so I won't include the full code in this blog post. See there if you want to run the code.
Initially we'll just do all of the analysis for a single day, later we'll graph these over time.
Finding arbitrages
The conditions for an arbitrage are simple. We're looking for a sell order and a buy order where:
The sell order has a lower price than the buy order, so we can buy from the seller low and sell to a buyer high.
The sell order has a higher available quantity than the minimum quantity for the buy order.
The code to find these is incredibly simple:
if sell_price < buy_price and int(sell["volume_remain"]) > int(buy["min_volume"]):
    # arbitrage found!
    arbitrages.append((sell, buy))
And now we have our list of sell/buy pairs that give us some profit if we manage to execute. I know I ignored taxes, but let's just ignore those for this post.
Building the jump graph
In EVE, each system is connected by stargates, which you have to jump between. CCP provides a list of connected systems in the static data export linked above.
We can construct the universe graph:
with bz2.open("mapSolarSystemJumps.csv.bz2", mode="r") as data_csv:
    route_contents = data_csv.read()

route_contents_f = StringIO(bytes.decode(route_contents, "utf-8"))
route_reader = csv.DictReader(route_contents_f)

G = nx.Graph()

for row in route_reader:
    G.add_edge(row["fromSolarSystemID"], row["toSolarSystemID"])
Then to calculate the number of jumps between two points (solar system IDs):
len(nx.shortest_path(G, arb["from_system"], arb["to_system"]))
Very simple and fast - the universe graph isn't actually that big or dense.
How much do these opportunities return?
We would expect smaller initial investments to be able to return more: there are probably opportunities to double or triple 1M ISK but few to do the same with 100M.
We can graph the best return % in each snapshot (over the course of a day) in 2023 with 1M, 10M, 100M, and 1B in initial capital.
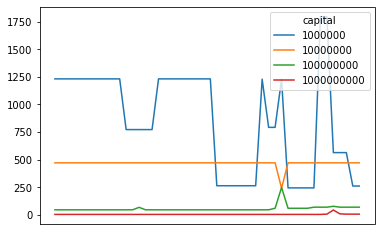
Holy shit, 1000% return for each arbitrage? The picture changes when we take into account jump distances and instead graph the return per jump for each opportunity:
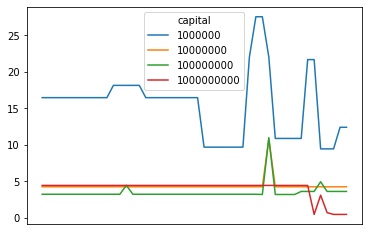
But the concept stays the same - having more capital means lower returns. The returns just look a little less crazy now.
This graph takes into account compounding. i.e. a 100% return per jump with 2 jumps means you double your money twice for a 300% return overall. A simple division would mean the return is 300% overall, divide by two jumps gives 150% return per jump. We actually want to take the nth root of one plus the return, where n is the number of jumps.
Are these opportunities really risk free?
No. Hauling anything valuable through low or null sec systems is always dangerous. People camp gates and will kill you. That's the main risk.
The other risk is that the buy order you want to sell into will disappear or get corrected before you get there, leaving you holding the bag. This risk can be detected and mitigated. If the sell order you're buying from is mispriced (price significantly lower than the regional average) but the buy order isn't, you're probably fine. If the buy order does disappear, you can sell to another averagely priced order and still make the money.
If the buy order is mispriced too high, then there is risk.
Given historical market data, we can detect arbitrages and calculate probabilities of whether the buy order will disappear by checking whether it did - either someone fulfilled the order or it was corrected. Then we can assign an expected profit to each opportunity based on those probabilities.
I didn't implement this given there are (I think) better ways to make money, but it is interesting to think about.
If botting were allowed in EVE, no doubt all these opportunities would be gone. Or maybe people would regularly go full Knight Capital and create even more opportunities. Hard to say.
Conclusion
I'm pretty sure mining, PvP, doing raids, whatever, probably earns more money with much less analysis. This isn't the point. The analysis is the point!
I didn't answer all of the questions at the start.
Some things I want to implement in future:
Return per jump, taking into account your current position. A great opportunity near Jita isn't that great if you're 20 jumps from Jita.
Analysis of how fast a player can make money over time using a particular strategy. i.e. backtesting and simulating trading. Is this a waste of time long term?
Simulating other strategies e.g. making markets by placing buy and sell orders for the same item in the same place. Getting good enough at that may have higher returns for less risk.
Adding route security preferences and cargo size limits.
Determining whether the buy or sell side of the arbitrage is mispriced. If the sell is mispriced, you just have to buy at the low price and can sell at your leisure. If the buy is mispriced, you have to sprint from sell to buy - if it's gone (cancelled, amended) when you get there, you might just be fucked. I have to know whether to be nervous or not!
There's a lot of other stuff I'd like to know.
The code I'm using is also really slow, I haven't put any effort into
optimising or profiling anything. The data could be re-encoded from .csv.bz2
(compressed text) files into Parquet or Avro files. Bzip2 is notoriously slow
too, that can likely be improved.
The best route would probably be to convert all the files to a better file format (e.g. Parquet) then load everything and analyze it using e.g. Dask.
And jump distances could likely be pre-calculated.
Next time, I'll write a bit more about the technical details of analyzing a multi terabyte dataset with only 32 GB of memory, and try to get the analysis much faster so I can iterate. Right now I'm waiting minutes for a single day's worth of analysis.